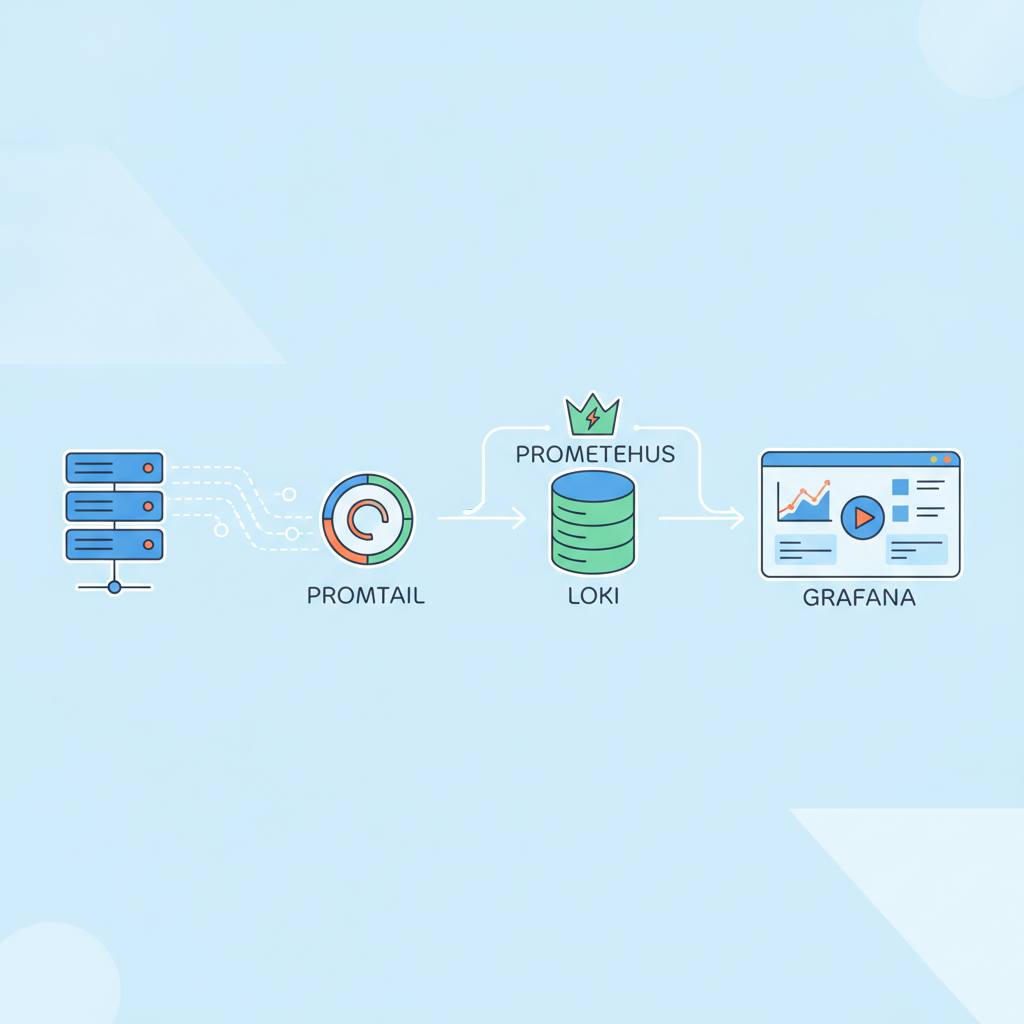
A new guide simplifies setting up a powerful system for monitoring application logs using popular tools like Grafana, Loki, Promtail, and Prometheus. This complete stack helps you easily collect, store, and visualize all your log data.
Hey WondTech readers! We've got some exciting news for anyone dealing with application logs. A comprehensive new guide has just been released, showing how to set up a powerful system for monitoring your application logs using a combination of excellent tools: Grafana, Loki, Promtail, and Prometheus. This guide makes understanding and tracking what's happening inside your applications a whole lot easier. What does this mean for you? If you've spent endless hours trying to figure out why an application crashed, or how a specific system is performing, this setup offers a clear solution. It gives you a comprehensive and clear view of your system's health and performance, helping you spot issues quickly and make better decisions. No more digging through log files manually; instead, you get valuable insights presented in an organized way. Let's take a quick look at the tools involved and how they work together: * **Loki:** Think of Loki as a massive library designed specifically for storing your logs. It's where all those application messages you need to track go to reside. * **Promtail:** This is the smart helper that collects logs from various sources in your system, like log files from your applications (such as Wildfly mentioned in the guide), and sends them directly to Loki. It works quietly in the background, ensuring no message is missed. * **Prometheus:** While Loki focuses on logs, Prometheus is the champion of collecting metrics. These are the numerical data points about your system, like CPU usage, memory consumption, and request counts. Prometheus and Loki work hand-in-hand to provide a complete picture. * **Grafana:** This is your dashboard. Grafana takes all the data from Loki (logs) and Prometheus (metrics) and turns it into easy-to-understand graphs and charts. You can customize your dashboards to see exactly what matters to you, in real-time. Together, these tools form a complete monitoring solution, often called an 'observability stack.' This means you won't just see logs, or just metrics; you'll see them together, in one place. This integration makes troubleshooting and analyzing application performance much simpler. The guide provides practical and clear steps, even showing how to set everything up using Docker Compose, which makes deployment very straightforward. This set of tools is open-source, meaning they are free to use and benefit from a large community's support. It's a fantastic opportunity to gain better control and visibility into what's happening within your applications and environments.